
By Holly Bengfort on Aug 4, 2026, 11:38:35 AM


As individual coverage health reimbursement arrangements (ICHRAs) gain traction, one of the most common questions employers ask is: "How much should we contribute to an ICHRA?"
While there isn't a one-size-fits-all answer, understanding how similar organizations structure their tax-free dollars can help you or your clients design a competitive and sustainable employee health benefit.
In this article, we'll use data from Remodel Health's 2026 National ICHRA Report, the industry's largest vendor-specific ICHRA dataset, to benchmark average employer ICHRA contributions across 21 industries, explain how benchmarking works, and help you set contribution allowances with confidence.
In this blog post, you'll learn:
- Average employer contributions by industry and why they matter.
- How the benchmarking process at Remodel Health works.
- The key factors employers should consider when setting contribution amounts.
Why ICHRA contribution benchmarks matter
Unlike traditional group plans, individual coverage health reimbursement arrangements (ICHRAs) don't require employers to contribute a fixed percentage of monthly premium costs. Instead, employers offer a monthly contribution that employees can use to purchase their own individual health insurance policies.
That flexibility is one of ICHRA's greatest strengths. But how do you know whether your contribution is competitive?
Benchmarking helps employers:
- Offer employee benefits that attract and retain talent
- Stay competitive within their industry
- Balance healthcare costs with budget goals
- Understand how contribution strategies vary by workforce type
Rather than copying another organization's contribution amount, benchmarking provides context for making informed decisions.
Average monthly ICHRA contributions by industry
While organizations should perform benchmarking with their own location and employees in mind, looking at national trends can give you a good idea of how others are designing their ICHRAs.
The following benchmarks come from Remodel Health's 2026 National ICHRA Report, the industry's largest vendor-specific ICHRA dataset. To provide more representative averages, the analysis excludes organizations with fewer than five employees and removes statistical outliers.
|
Industry |
Employee only |
Employee + children |
Employee + spouse |
Family |
|
Arts, Entertainment, and Recreation |
$553 |
$666 |
$794 |
$812 |
|
Automotive |
$441 |
$602 |
$756 |
$805 |
|
Business Services |
$553 |
$703 |
$753 |
$921 |
|
Construction |
$535 |
$748 |
$957 |
$1,029 |
|
$612 |
$830 |
$1,024 |
$1,190 |
|
|
Farming and Agriculture |
$688 |
$900 |
$965 |
$1,067 |
|
Financial Services |
$604 |
$888 |
$1,009 |
$1,148 |
|
Food & Hospitality |
$471 |
$601 |
$662 |
$737 |
|
Government |
$699 |
$871 |
$1,933 |
$1,913 |
|
$579 |
$739 |
$829 |
$963 |
|
|
Long-term Care |
$575 |
$712 |
$931 |
$963 |
|
$642 |
$962 |
$1,126 |
$1,428 |
|
|
Nonprofit |
$730 |
$928 |
$1,072 |
$1,166 |
|
Real Estate |
$630 |
$754 |
$964 |
$928 |
|
Religious Organizations |
$714 |
$1,113 |
$1,257 |
$1,595 |
|
Retail |
$460 |
$512 |
$663 |
$698 |
|
Science and Engineering |
$641 |
$972 |
$1,211 |
$1,279 |
|
Social Services |
$647 |
$834 |
$832 |
$1,020 |
|
Tech |
$695 |
$915 |
$968 |
$1,167 |
|
Transportation |
$555 |
$593 |
$800 |
$918 |
|
Utilities |
$701 |
$894 |
$1,140 |
$1,231 |
Mission-driven organizations invest heavily in benefits
Nonprofit and religious organizations offered some of the highest average employer contributions, even though many operate with limited budgets. On average, nonprofits contributed $730 per month for employee-only health coverage, while religious organizations contributed $714 per month.
This suggests these organizations see health coverage as a strategic investment. By offering competitive benefits through an ICHRA, they can attract and retain talent while improving cost control and creating more predictable healthcare spending compared to a traditional group health plan.
Several industries contribute less, but still provide meaningful benefits
Food and hospitality, retail, automotive, and transportation generally offered lower employer contributions for health insurance premiums. For example, food and hospitality employers contributed an average of $471 per month for employee-only coverage, while retail averaged $460 per month.
These industries often:
- Employ more hourly or part-time workers
- Operate on thinner profit margins
- Experience higher employee turnover
Even with lower contribution amounts, an ICHRA allows employers to offer a tax-advantaged health benefit while giving employees access to comprehensive individual health insurance. This helps employers provide meaningful coverage without the administrative complexity and rising costs often associated with traditional group health insurance.
Family contributions vary much more than employee-only contributions
One of the most interesting findings is that employee-only contributions remain relatively consistent across industries, whereas contributions from employees with spouses or families vary much more.
This suggests many employers prioritize providing additional financial support to employees with dependents while maintaining tighter control over individual coverage budgets. Rather than applying a one-size-fits-all allowance, employers often increase contributions as household health insurance costs rise.
Average monthly ICHRA contributions by state
While national benchmarks provide a useful point of comparison, employer contributions can vary significantly by location. The table below shows the average monthly ICHRA contribution in the 20 states with the highest customer activity in Remodel Health's dataset after filtering out organizations with fewer than five employees and statistical outliers.
|
State |
Employee only |
Employee + children |
Employee + spouse |
Family |
|
Arizona |
$501 |
$534 |
$539 |
$605 |
|
California |
$695 |
$827 |
$826 |
$913 |
|
Colorado |
$555 |
$682 |
$724 |
$835 |
|
Delaware |
$666 |
$919 |
$907 |
$1,328 |
|
Florida |
$656 |
$784 |
$807 |
$949 |
|
Georgia |
$587 |
$673 |
$845 |
$986 |
|
Indiana |
$546 |
$789 |
$1,029 |
$1,143 |
|
Kentucky |
$618 |
$874 |
$1,049 |
$1,115 |
|
Maryland |
$635 |
$796 |
$900 |
$970 |
|
Massachusetts |
$719 |
$1,081 |
$1,185 |
$1,569 |
|
Minnesota |
$525 |
$684 |
$837 |
$934 |
|
North Carolina |
$535 |
$669 |
$815 |
$1,009 |
|
New York |
$612 |
$691 |
$707 |
$846 |
|
Ohio |
$577 |
$857 |
$1,052 |
$1,207 |
|
Oregon |
$645 |
$774 |
$844 |
$1,056 |
|
Pennsylvania |
$632 |
$913 |
$1,127 |
$1,283 |
|
South Carolina |
$670 |
$869 |
$894 |
$1,100 |
|
Texas |
$515 |
$667 |
$713 |
$766 |
|
Washington |
$530 |
$564 |
$667 |
$683 |
|
Wisconsin |
$487 |
$857 |
$1,113 |
$1,518 |
How to use these ICHRA contribution benchmarks
Industry benchmarks provide valuable context, but you shouldn't treat them as recommended contribution amounts.
Instead, use these averages to understand how your organization's contribution strategy compares to others in your industry. The right contribution depends on your workforce, business goals, and the cost of individual health insurance where your employees live.
As you review the data, consider the following questions:
- Are our contributions competitive? If your allowances are well below the industry average, employees may have less purchasing power than those at similar organizations.
- Are we balancing affordability and budget? If your contributions are significantly above average, there may be opportunities to better align your healthcare spending with your long-term budget goals.
- Are we supporting employees equitably? Consider whether your contribution strategy reflects differences in employee needs, such as age, family size, and geographic location.
- How do local insurance costs compare? Industry averages provide a helpful benchmark, but premiums vary by state, rating area, and age. A competitive contribution in one market may not provide the same purchasing power in another.
The most effective ICHRA contribution strategies combine industry benchmarking with a detailed analysis of your workforce and local insurance marketplace. That's why employers often use benchmark data as a starting point before customizing contributions to meet their organization's unique needs.
How Remodel Health benchmarks ICHRA contributions
While industry averages provide helpful context, every employer starts from a different place. That's why Remodel Health doesn't begin by recommending an industry-average contribution. Instead, we begin by understanding the employer's existing health benefit.
According to Alexis McCullough, Broker Account Executive at Remodel Health, every benchmark analysis starts with the employer's current group health plan.
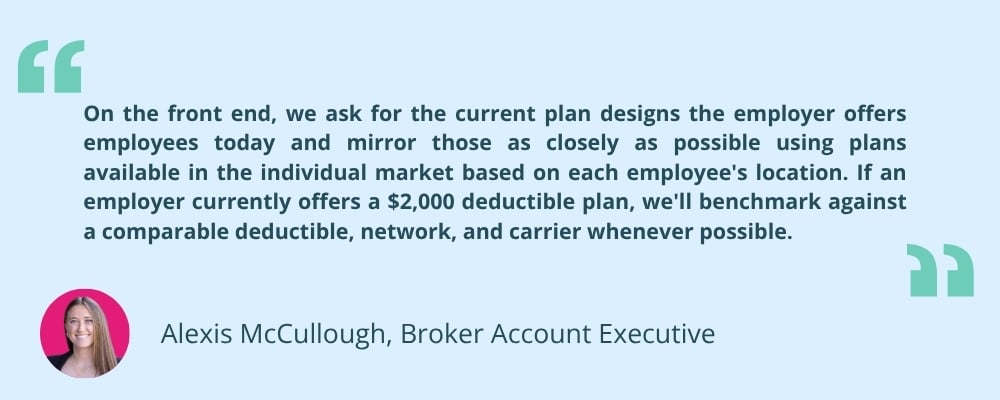
"On the front end, we ask for the current plan designs the employer offers employees today and mirror those as closely as possible using plans available in the individual market based on each employee's location," McCullough said. "If an employer currently offers a $2,000 deductible plan, we'll benchmark against a comparable deductible, network, and carrier whenever possible."
Starting with a comparable plan allows employers to evaluate an ICHRA without unintentionally reducing the value of their health benefit.
Remodel Health's proprietary benchmarking software identifies individual health plans that closely align with the employer's existing coverage. The software prioritizes plans with comparable deductibles, key plan features, such as HSA eligibility, and preferred insurance carriers with strong provider networks and overall plan quality.
This creates an apples-to-apples comparison between the employer's existing group medical insurance plan and available individual health plans, allowing employers to evaluate ICHRA using equivalent benefit designs whenever possible.
Once comparable plans are identified, Remodel Health builds an age-banded contribution model based on the employer's existing contribution strategy. From there, our team works collaboratively with brokers and employers to evaluate projected employee costs, refine contribution levels, and ensure the final ICHRA design balances budget goals with employee affordability.
The result is a customized contribution strategy based not only on industry benchmarks, but also on the employer's workforce, geographic footprint, and existing benefits.
How the benchmarking process works
The benchmarking process at Remodel Health follows five steps:
- Review the employer's current group health insurance plan
- Identify comparable individual plans using Remodel Health's benchmarking software
- Build an age-banded contribution model
- Review employee impact and employer costs with the broker and employer
- Adjust contributions until the strategy meets both budget goals and employee affordability objectives
Why contributions vary between employers
Industry benchmarks are helpful, but they rarely tell the whole story. Several factors influence how much an employer contributes through an ICHRA.
Geographic location
Individual health insurance premiums vary based on:
- State
- Rating area
- Employee age
- Carrier competition
An employer in Texas may need a different contribution than an employer in Florida or New York to provide employees with comparable purchasing power.
Workforce demographics
Contribution strategies often depend on workforce characteristics, including:
- Average employee age
- Full-time versus part-time workforce
- Number of employees covering dependents
- Employee locations
A younger workforce may require a lower contribution than an older workforce because individual market premiums generally increase with age.
Existing benefit strategy
Most employers don't start from scratch. Instead, they compare their current traditional group health plan with comparable individual market coverage and use that analysis to determine how much purchasing power they want employees to have.
For organizations transitioning from group medical insurance, this creates a smoother employee experience while preserving the value of their health benefit.
Budget and business goals
Some employers are looking to:
- Replace an increasingly expensive group healthcare plan
- Offer health benefits for the first time
- Improve recruiting and retention
- Gain greater predictability over healthcare spending
Each objective can lead to a different contribution strategy
Conclusion
Choosing an individual coverage health reimbursement arrangement (ICHRA) contribution amount is one of the most important decisions employers make when designing their health benefit. While industry benchmarks provide valuable context, the right contribution depends on your workforce, budget, and benefits goals.
Using the industry's largest vendor-specific ICHRA dataset alongside proprietary benchmarking software, Remodel Health helps employers and brokers design ICHRA contribution strategies with confidence.


Individual Health Insurance vs. Traditional Group
Remodel Health explains how individual health insurance plans are the superior choice and why traditional group plans are a thing of the past.

HRA Council Report: Growth trends for ICHRA
The latest HRA Council report reveals key growth trends for ICHRA. See what rising HRA adoption means for the future of health benefits.

Carriers are investing in ICHRA-specific and specialized health plans
Carriers are building ICHRA-specific plans to meet rising demand. Explore how these tailored health plans improve access, pricing, and employee choice.